
U.S. stock market valuations have climbed above levels last seen before the 1929 crash, and the internet is predictably freaking out. But before you sell everything and buy gold, let's talk about what this actually means—and what it doesn't.
The Numbers Everyone's Talking About
The Shiller CAPE ratio (Cyclically Adjusted Price-to-Earnings ratio) for the S&P 500 has pushed well above its long-term average. This metric, developed by Nobel laureate Robert Shiller, smooths out earnings over 10 years to account for economic cycles. When it's high, stocks are expensive relative to their earnings history.
Right now, it's expensive. Very expensive. Like, "last time we were here, the Great Depression followed" expensive.
But here's what the doom-and-gloom headlines won't tell you: the CAPE ratio has been "too high" for years. It hit concerning levels in 2013, 2015, 2017, 2019, and 2021. If you sold every time someone said valuations were stretched, you'd have missed one of the greatest bull markets in history.
What's Actually Driving This
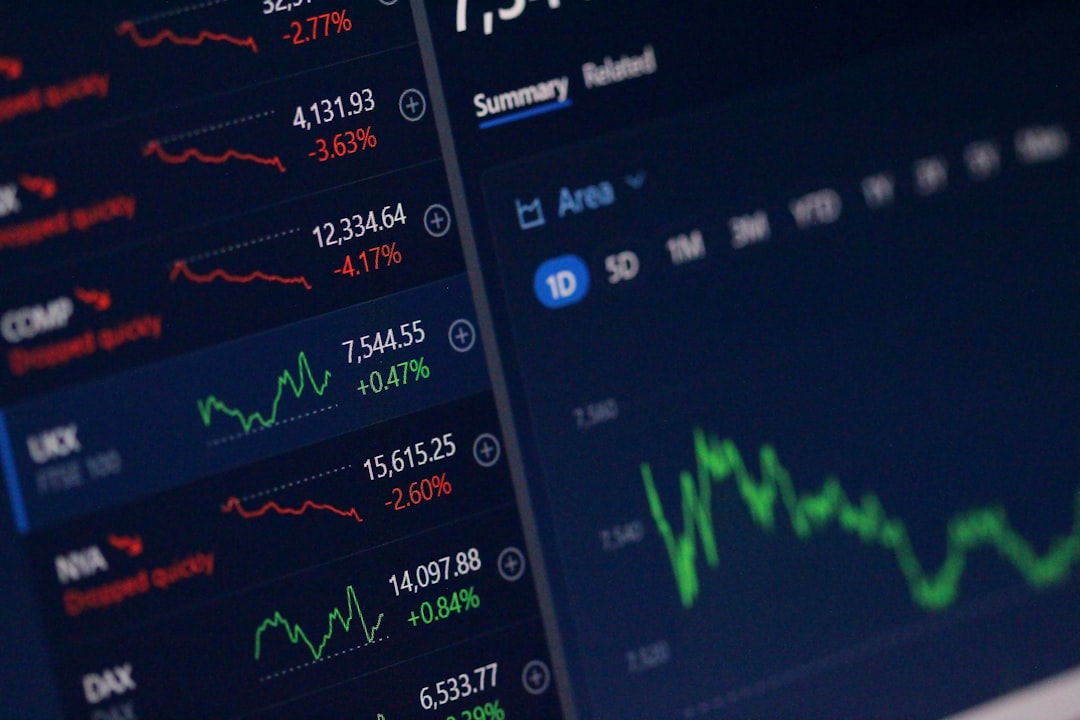
The current rally isn't some irrational frenzy across all sectors. It's concentrated in a handful of AI leaders, primarily Nvidia and Microsoft. Nvidia recently gained over 4% in a single trading session, and Microsoft added more than 2%. These moves ripple through the entire market because tech companies now make up such a massive portion of major indices.
When people say "the market is at 1929 levels," what they really mean is "a few AI companies have gotten incredibly expensive, and they're dragging the averages up with them."
That's a very different situation from the broad-based speculation that preceded the 1929 crash.
The Crosscurrents That Actually Matter
While everyone obsesses over the CAPE ratio, here's what should actually be on your radar: